CHR WEEKLY
Findings Through Week 20, 2020
Sellers are back and bringing new properties on the market at normal levels for this time of year. And buyers went on a buying spree in Week 20 by snatching up almost 1700 homes … an all-time record high for any one week in metro Denver. This is keeping the overall inventory low and the days on market short and has the market continuing to favor sellers.
Note: The weeks shown in the charts below begin on Wednesday and end on Tuesday. Week 20 was from May 13th thru May 19th.
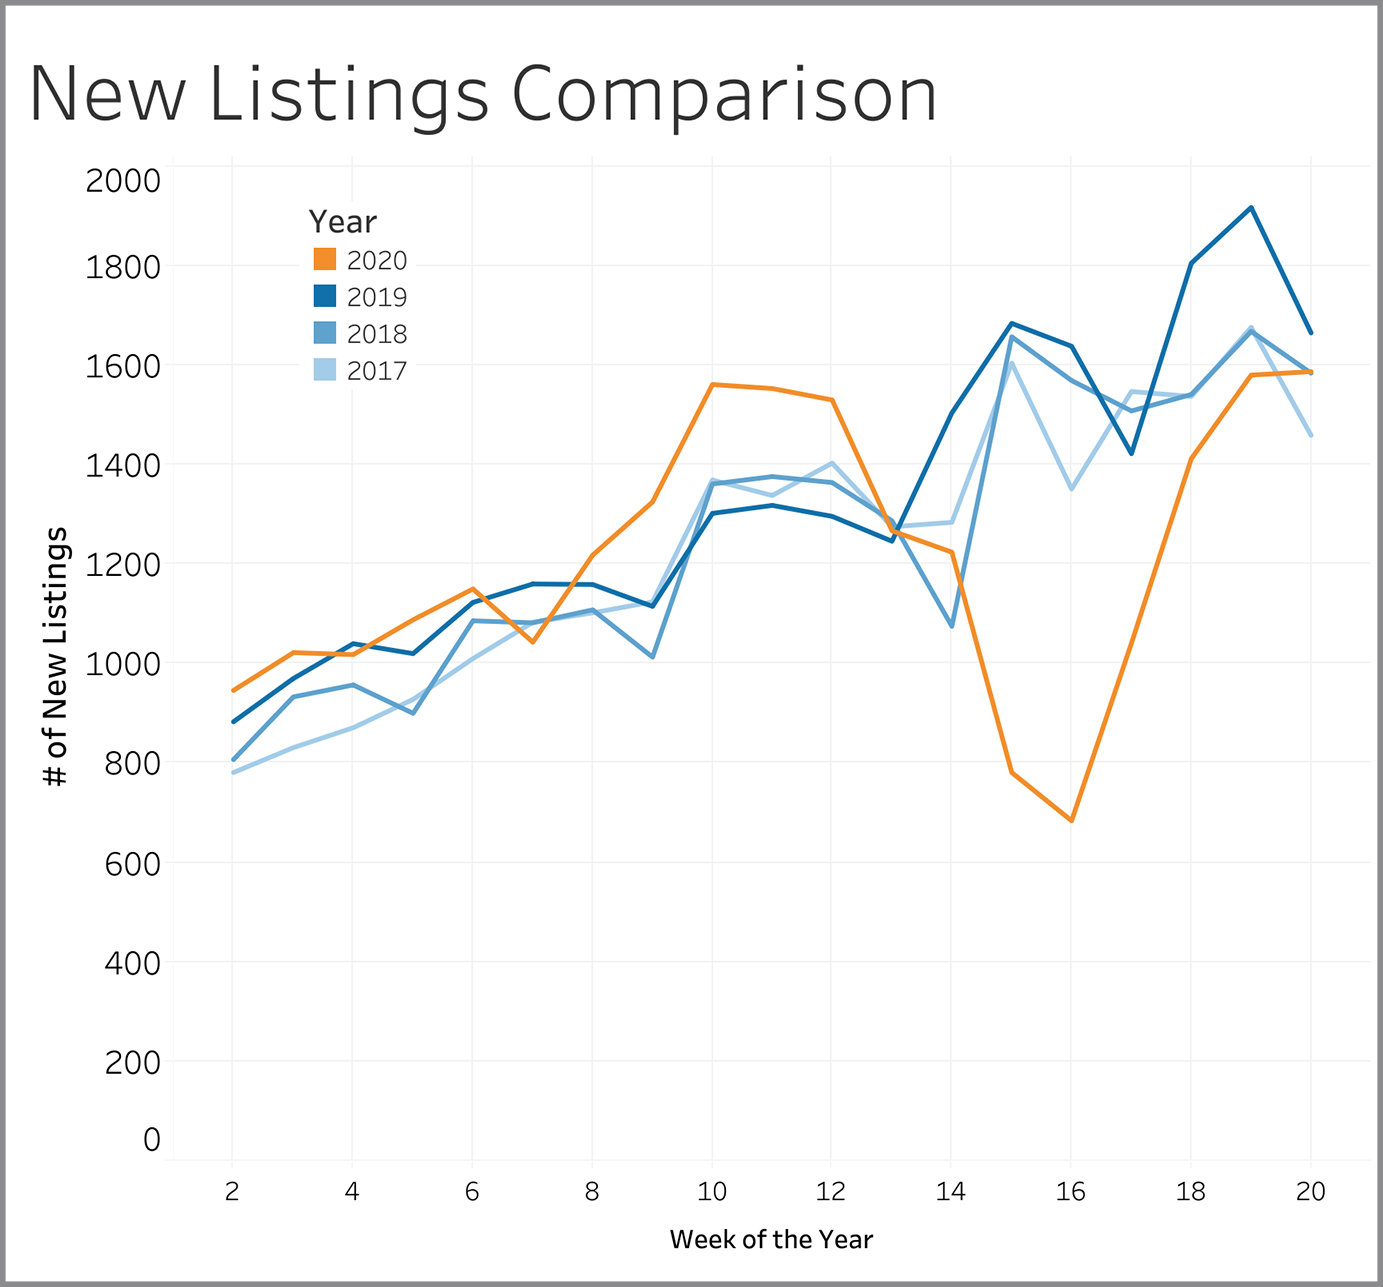
New Listings
New listings reflect seller attitudes on whether this is a good time to be selling. The four weeks of declining numbers that started in Week 13 have been followed by four weeks of recovery. The 1600 homes coming on the market in Week 20 is similar to what we experienced in the three prior years.
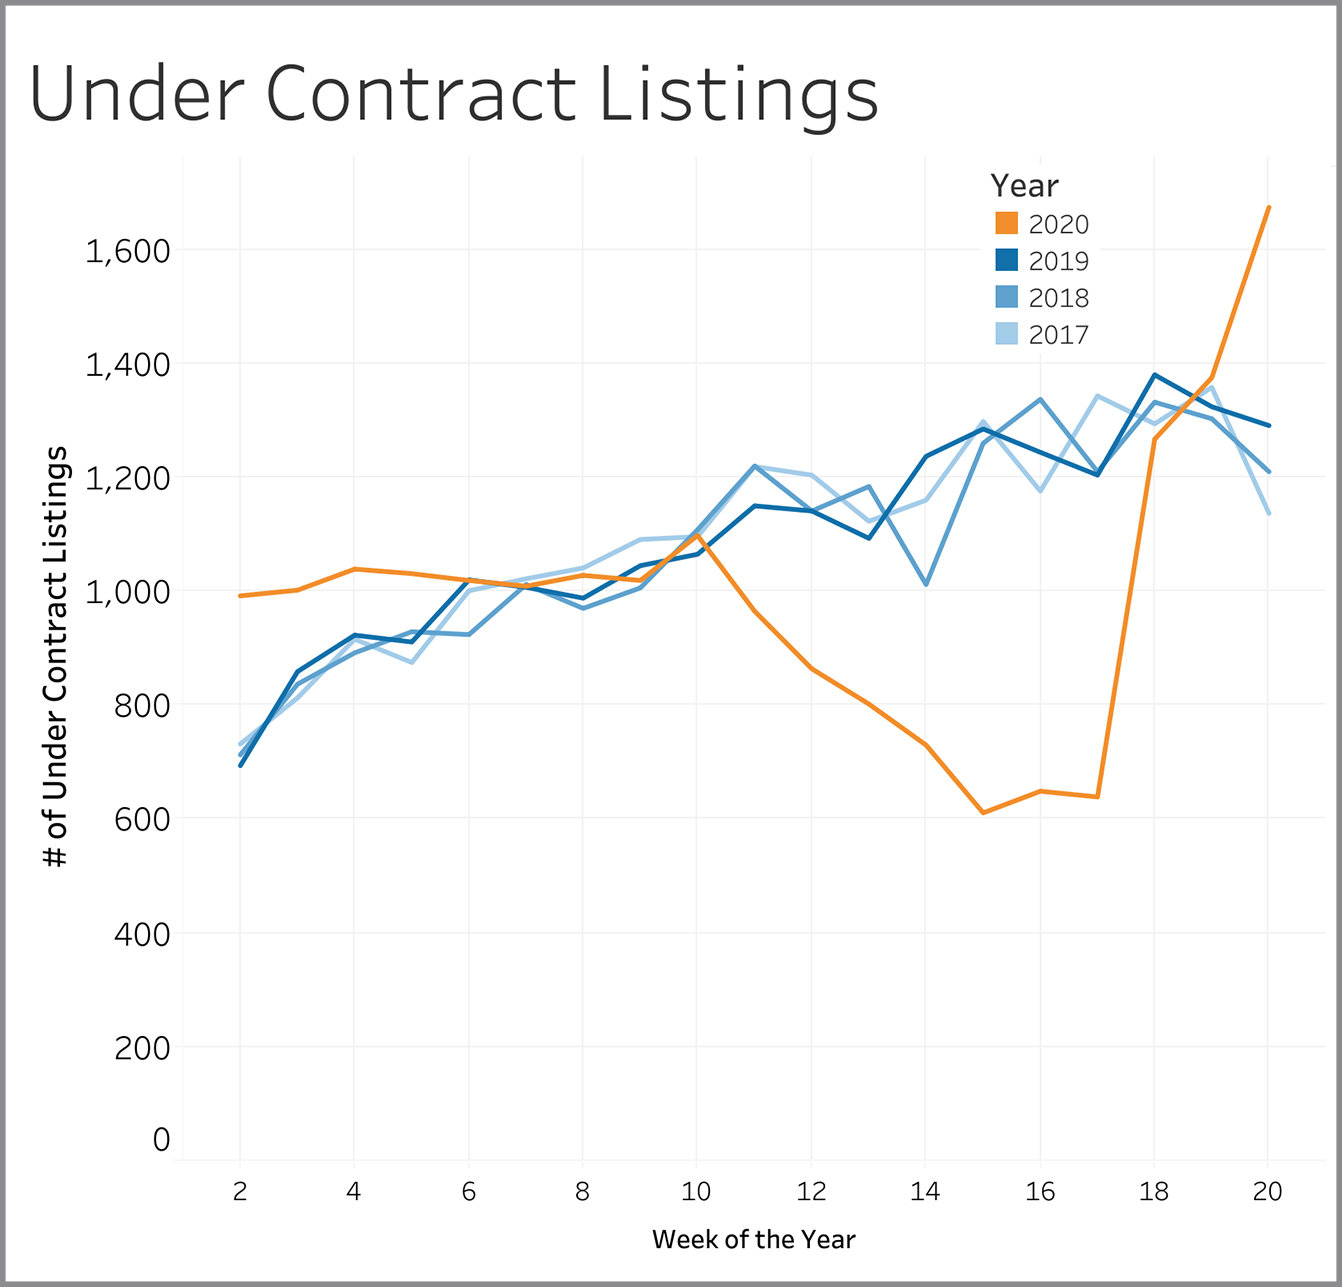
Under Contract Listings
Properties going under contract show us whether buyers are confident to do business in the current market environment. They were very confident in Week 20 as they put almost 1700 homes under contract. That is 30% to 50% higher than numbers seen in 2017 through 2019.
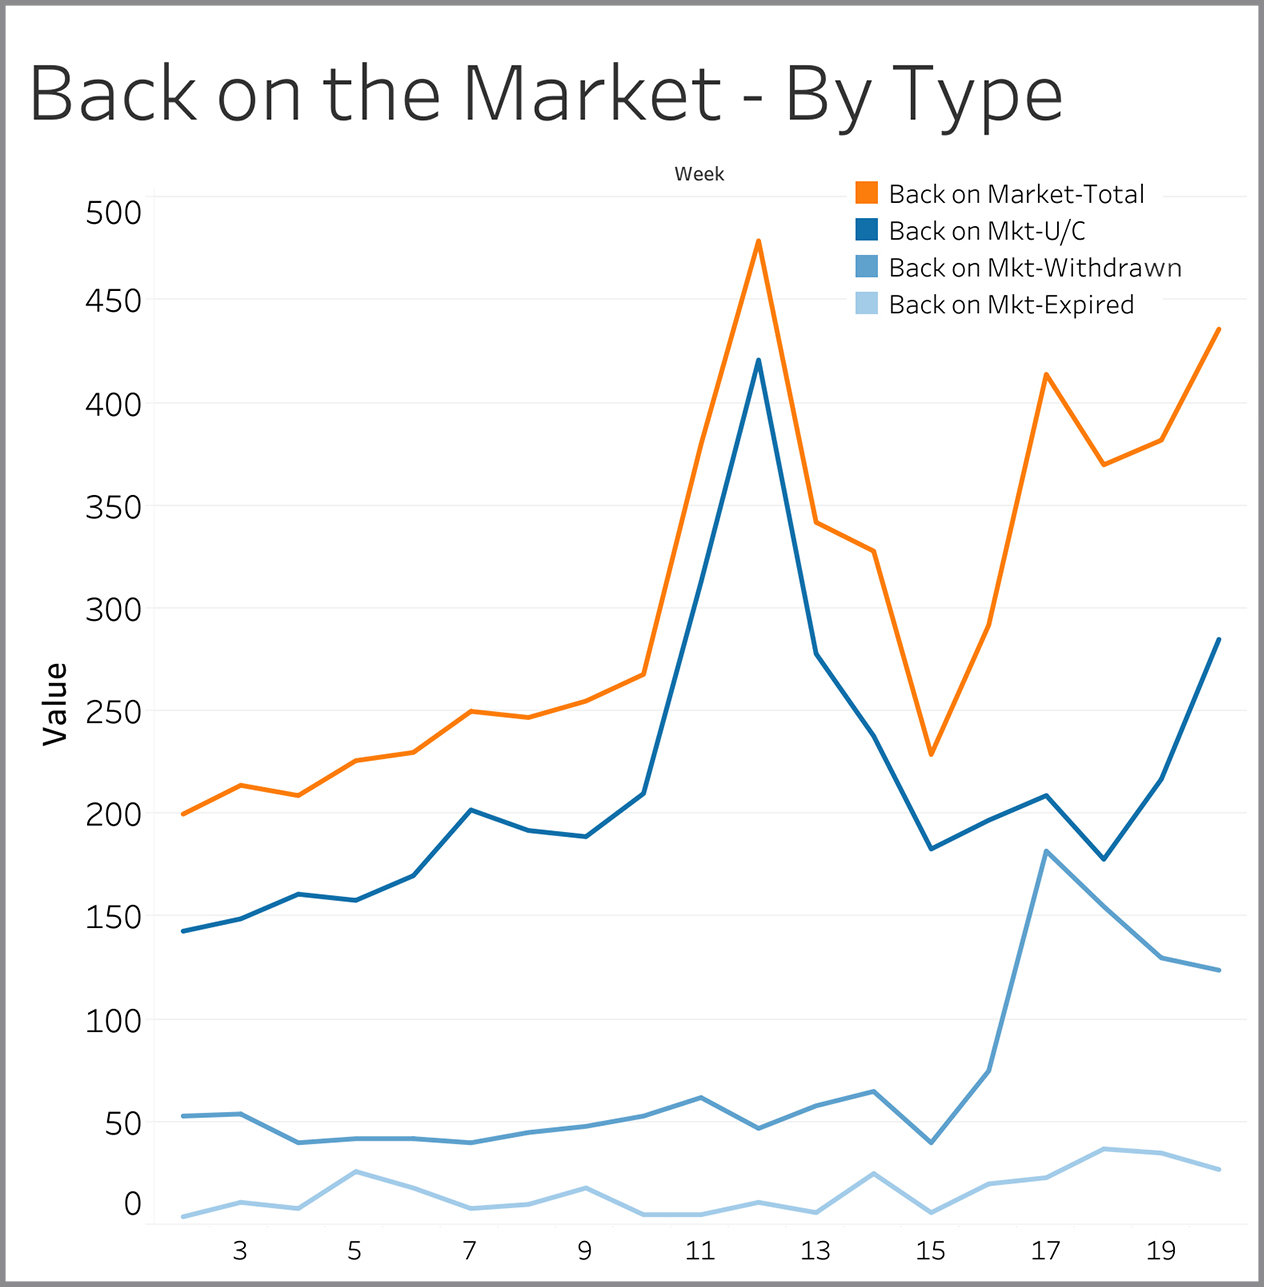
Back on Market – By Type
Listings come back on the market for three reasons: (1) Sellers lost a deal with one buyer and are now looking for another one; (2) Sellers took a break from showing the property and are now allowing showings again; (3) Sellers let their listing expire and then came back to the market within 30 days with either the same agent or a different agent. Losing a buyer accounted for 65% of the properties coming back to the market in Week 20. The overall number of homes coming back on the market continues to run above normal – close to 450 in Week 20 versus the 250 to 350 that was typical in the three prior years (data on prior years not shown on this chart).
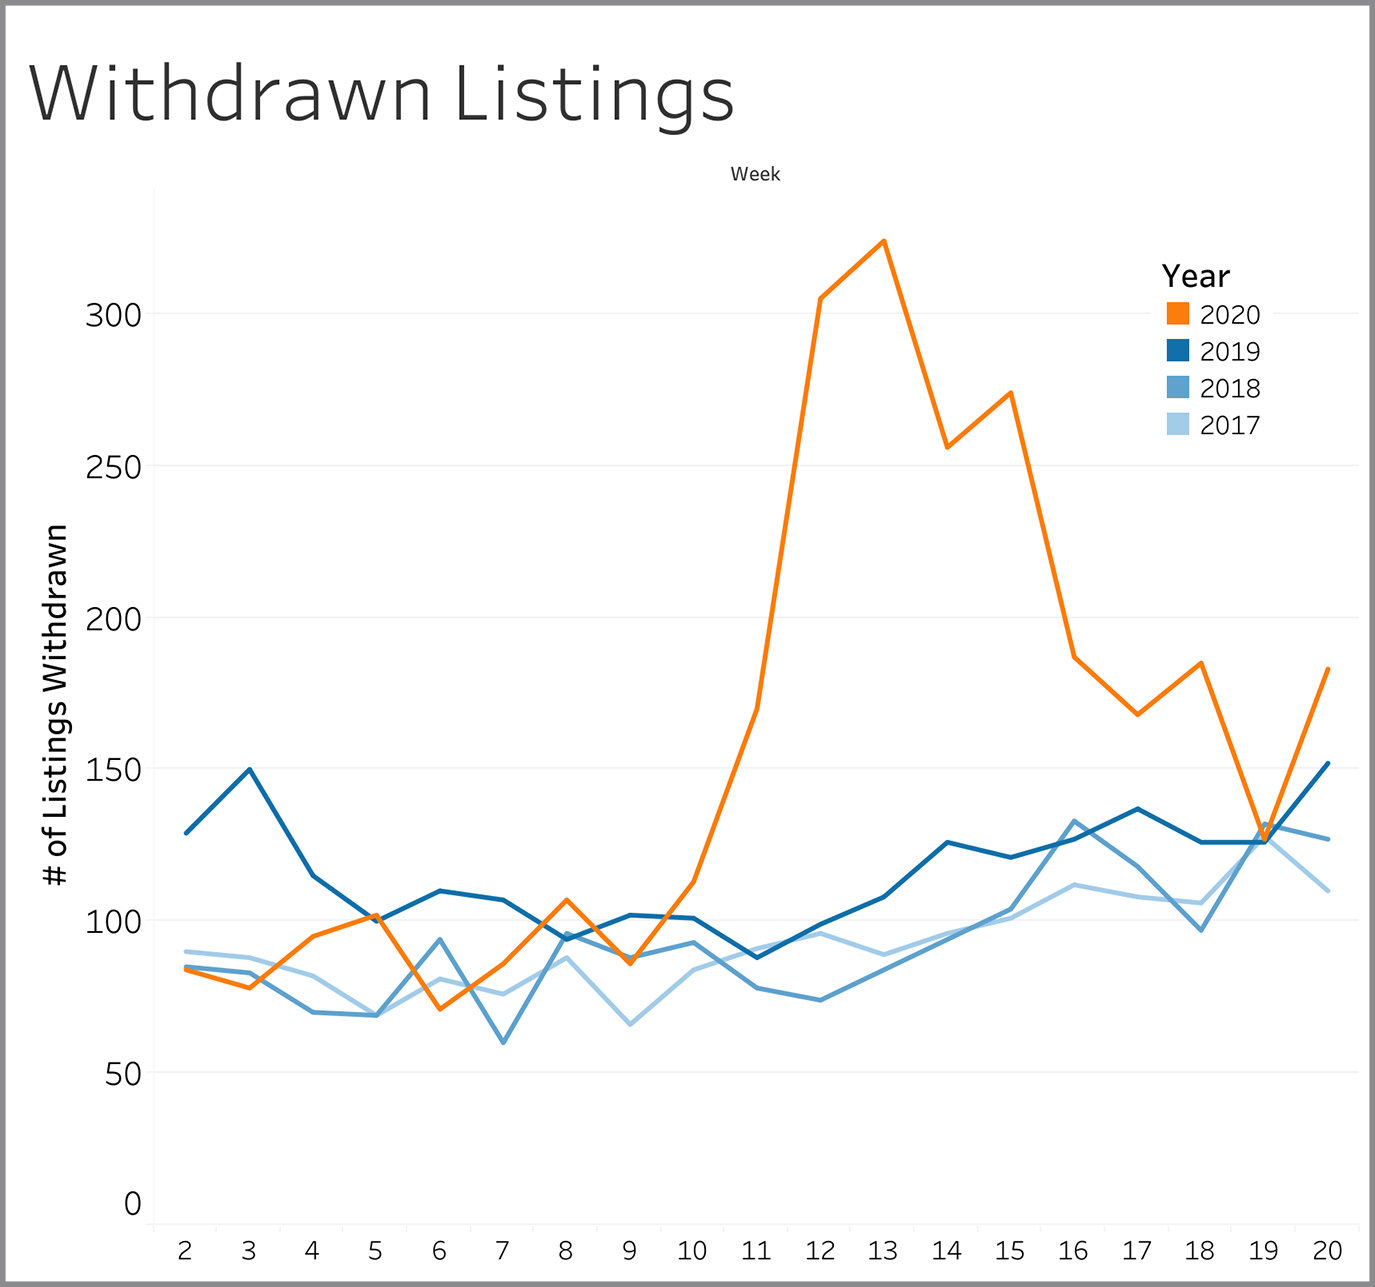
Withdrawn Listings
Withdrawn listings are sellers that have either given up altogether on selling or that have temporarily halted showings. At roughly 180 in Week 20, it is slightly above the norm of 110 to 150 established in 2017 through 2019.
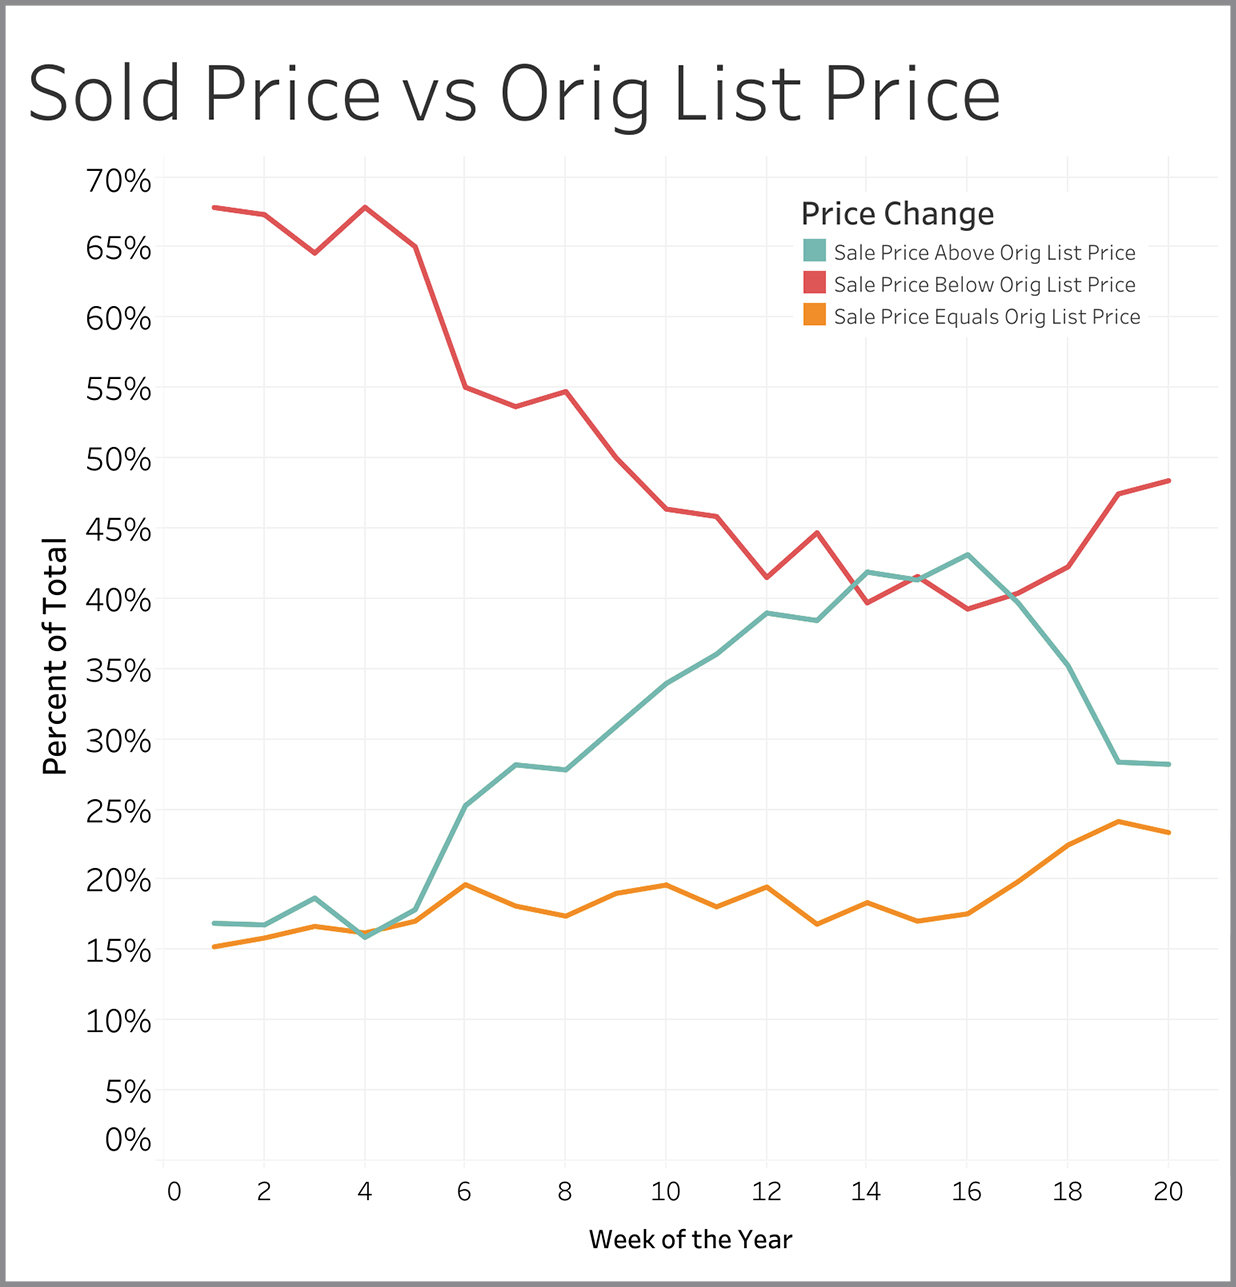
Sold Price vs. Original List Price
It’s a 50/50 deal in Week 20, with half of the homes selling at or above the original asking price and the other half getting something less than full price.
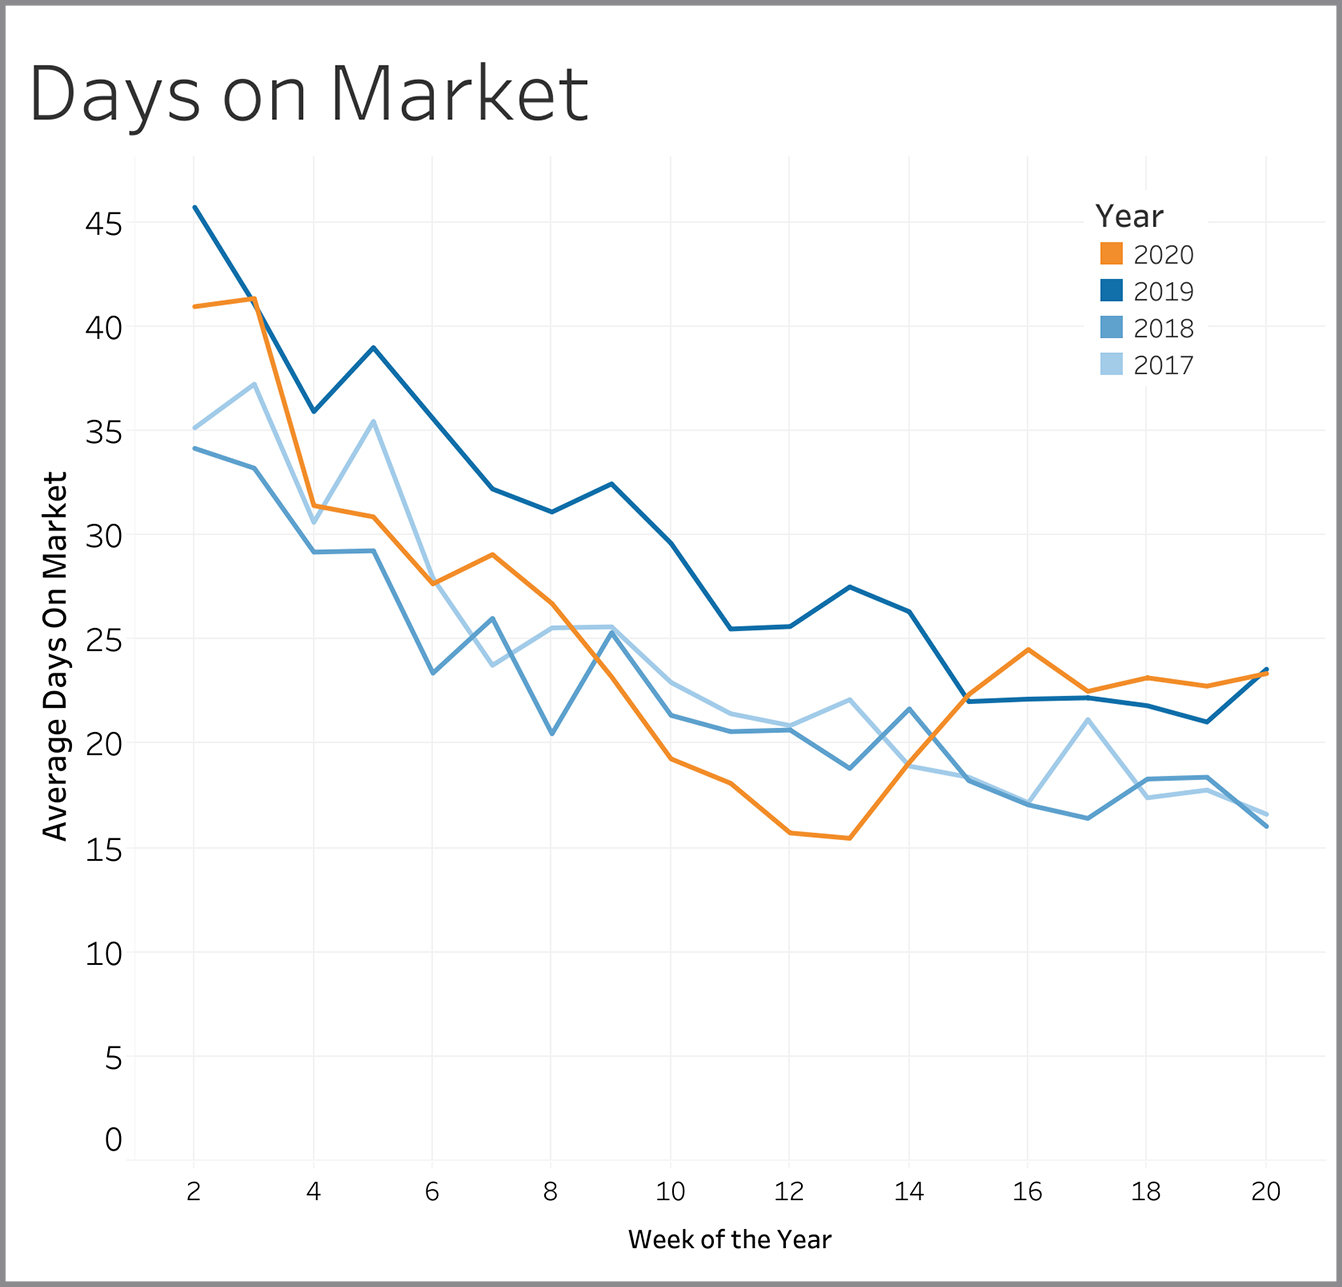
Days on Market
Days on market is measured from the time a property first comes on the market to when it goes under contract. For the last five weeks, the number of days it takes to find a buyer has been very similar to the number of days it took in 2019.
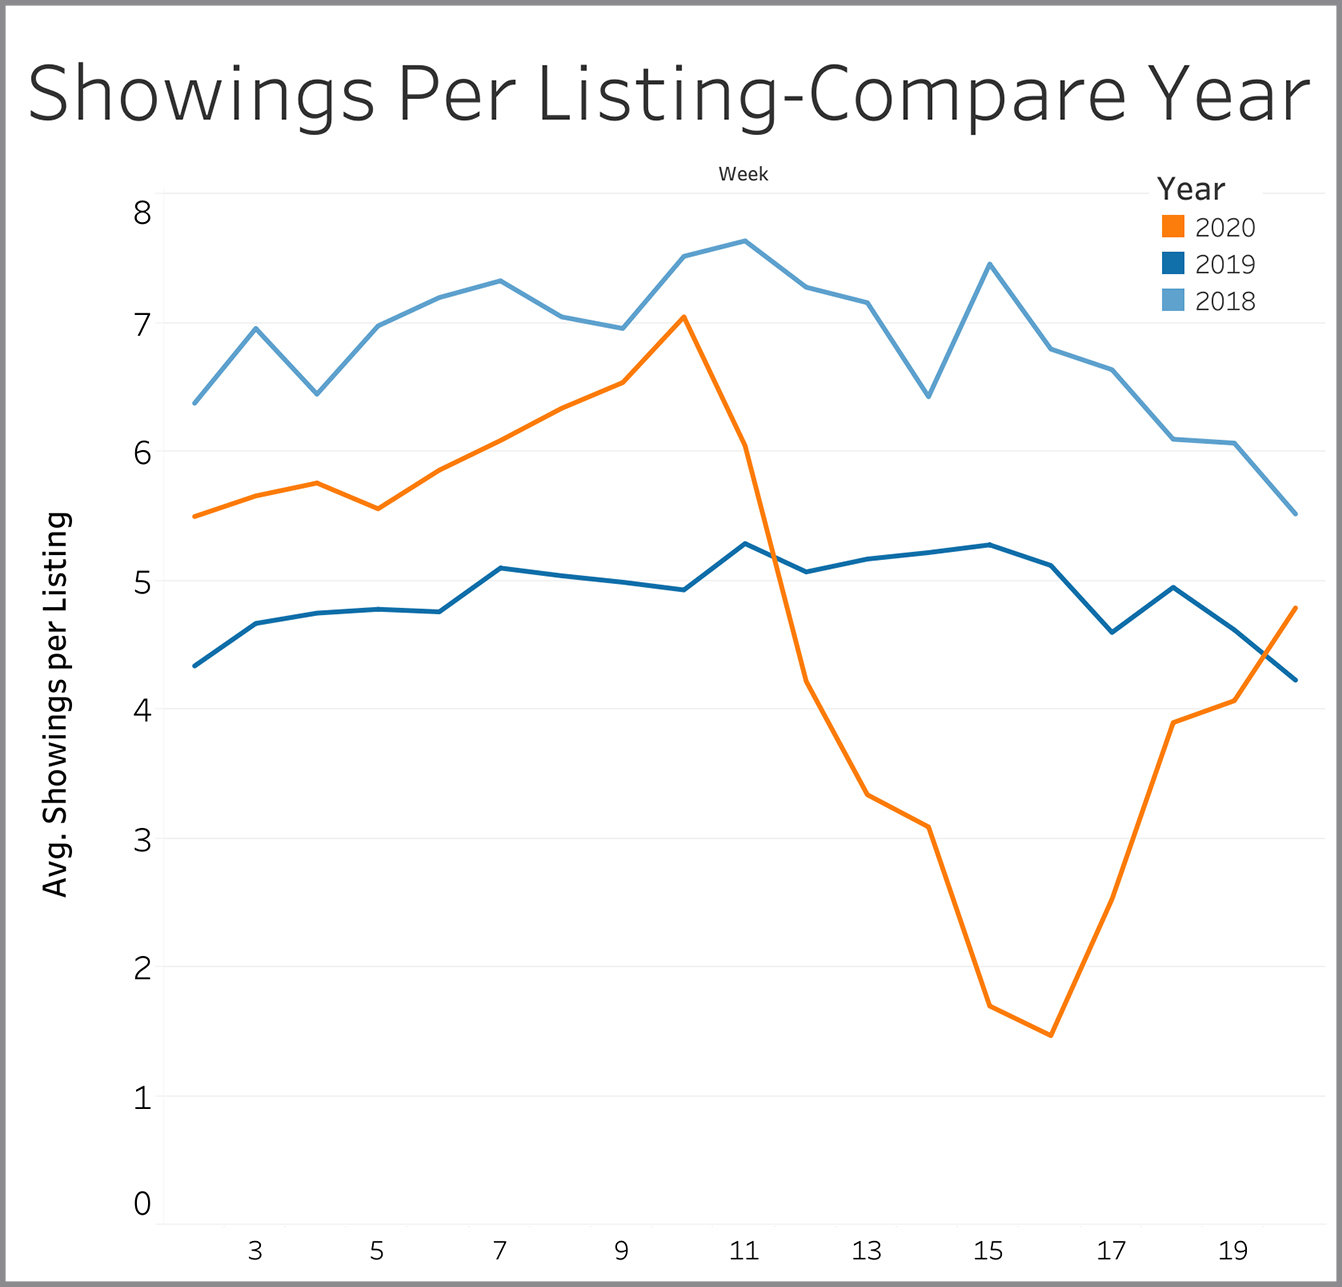
Showings Per Listing
We saw this metric decline consistently after Week 10, but the pattern reversed in Week 17 and has returned to normal levels for this time of year.